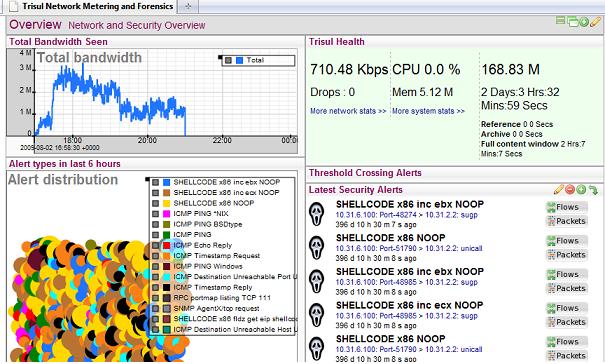
 We are excited to announce the availability of a spanking new product for network & security monitoring. The name of the product is Trisul Network Metering and Forensics platform (or just Trisul ). Trisul is the Sanskrit name for a Trident- the three pronged weapon used to destroy evil.
This is the first of a series of blog posts and screencasts where we will try to explain the features of the product in depth.
What does it do differently
Trisul monitors traffic statistics at a very fine grained level. It then adds in flow data, raw packets, and optionally security alerts to give your analyst everything he/she needs while researching an incident. Trisul can also be used as a continuous monitoring platform providing network situational awareness to network teams.
So lets quickly look at each of these
Fine grained network monitoring
Network traffic monitoring lies at the core of Trisul. We like to call it traffic metering because Trisul continuously tracks key traffic meters at different layers. Out of the box, Trisul tracks over 120+ meters and you can add your own custom rules.
Lets see a few examples
Simple meters :
- Want to know total bandwidth used by host X ? You got it
- Want to find out total L2 broadcast traffic ? You got it
- Want to know top Hosts by connections ? Yes
Complex meters :
- Want to find out traffic by HTTP-Content-Type ? You got it
- Want to find out traffic by HTTP Host ? You got it
- Traffic by country, ASN ? Yes
- How many new flows are being created / expired per second ? You got it
Combine meters :
- Top internal hosts talking to China or Ukraine ? Yes
Now here is what is really cool and innovative about Trisul : It does not summarize of roll up any these meters. It stores them at the basic resolution for months. A customized map/reduce database technique allows instant long term reporting at this resolution.
Flow data
Network monitoring can give you a picture of utilization but not about activity. It can tell you there was a surge of outbound traffic on Port-18000 around 4AM last night, but it cant tell you which hosts were responsible.
Enter flow data.
Trisul tracks bi-directional flows and stores them in a ready to report format. You can get sub 10-second responses for 100M flows /day. Just like traffic meters, this flow data is stored unsummarized. Trisul also has a special feature called a Flow Tracker which picks out the flows that might be most intriguing to you. An example of a flow tracker : From millions of flows – Trisul can track separately the flows that transferred most data out of your network.
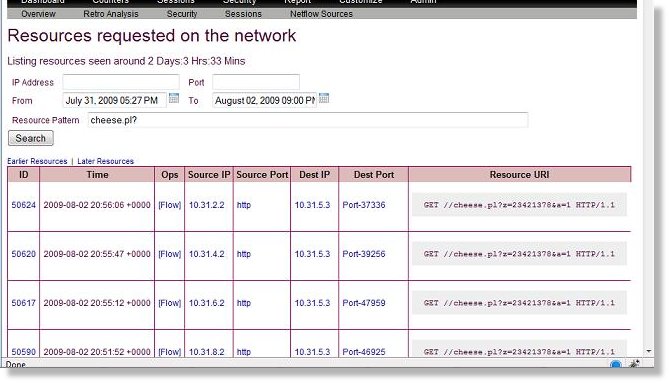
We shall see in future blog posts, how this flow data can be leveraged with raw packets, alerts, and resources.
Raw packets
Infosec professionals have long known the value of raw packets in retrospective analysis. Many security pros have built then own ways to delve into packets by stitching together various open source tools. Trisul will make interacting with packets secure, flexible, and fast.
Some of the features :
- Policies for cutting down on storage requirements
- All caps encrypted by AES-256 CTR – disk subsystem never sees clear text packets
- Tiered architecture allows you to use a combination of disk technologies
- Sophisticated flow capping policies are available
Raw packets are not used by Trisul merely to pull up packets for flows or alerts. They are used in a breaking innovation of Unleash Networks called “Cross Drill”. Cross drill allows you to answer questions that you cannot get from flow data.
Examples of Trisul Cross Drill
- Which hosts consumed maximum amount of HTTP Content-Type “x/flv” ?
- Which hosts in my network are talking to India ?
In future blog posts, we will expand on the cool things you can do with this raw packet storage.
Alerts
Trisul supports 4 types of alerts.
- Built in support for Threshold Crossing Alerts
- Built in support for Flow Tracker Alerts (suspicious flow activity)
- Built in support for Malware / Spam blacklist alerts (via the Badfellas plugin)
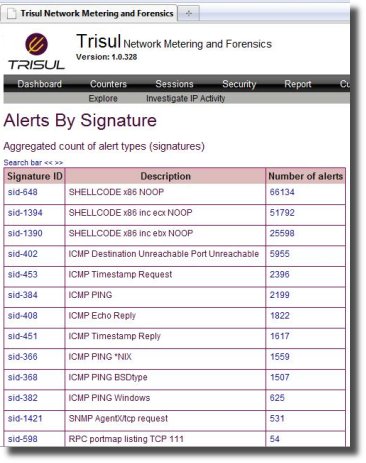
- Third party feed of alerts – current supports Snort and Suricata (via Barnyard2)
Lets look at the 4th type of alerts a bit closer (IDS alerts).
First, in many cases just the statistics/ flows/ pcaps features of Trisul are sufficient. However, you can easily get Trisul to meter and cross index IDS alerts as well.
Trisul can accept IDS alerts from a local instance of Snort/Suricata using the Unix Sockets feature of Snort or Barnyard2.
The benefits of correlating alerts to traffic are significant and in some cases even eye opening. Trisul has many ways of looking at alert data with various grouping criteria. You can move from alerts to flows to pcaps. The great thing is all this is scriptable using the Trisul Remote Protocol.
Please read our documentation for more details and how to set things up.
Exciting times ahead for Network Security Monitoring teams.


