Network based forensics of P2P traffic has many applications, particularly in law enforcement. Recently, I added preliminary support for Gnutella in Unsniff Network Analyzer as a proof of concept. Wireshark has a rather rudimentary support for this protocol.
We would like to :
- Monitor what various subjects are searching for on the P2P network
- Monitor query responses including the filenames and their respective SHA1 hash
- Identify the file actually downloaded
- Reconstruct the file actually downloaded
This blog post is a summary of what I found and how you can put this feature to use.
Setup
This was the test setup.
- Limewire 5.5.9 which connects using the Gnutella Protocol 0.6
- Connected to the Gnutella network using the default setttings
- Searched for “flotilla” videos
- Downloaded one of them
All traffic from startup to shutdown of Limewire was captured using Unsniff. You can convert these files to libpcap format by opening them in Unsniff and selecting File > Export > TCPDUMP
| Limewire_Complete.usnf | Contains complete traffic dump including bootstrapping, punching hole via UPnP, handshakes, downloading the file, and shutdown |
| Limewire_Handshake.usnf | A single TCP session which contains a Gnutella handshake. Recommend you start here first to understand how the compression works |
Notes on protocol
A quick note about the P2P protocol elements viewed from a forensics viewpoint.
Bootstrapping
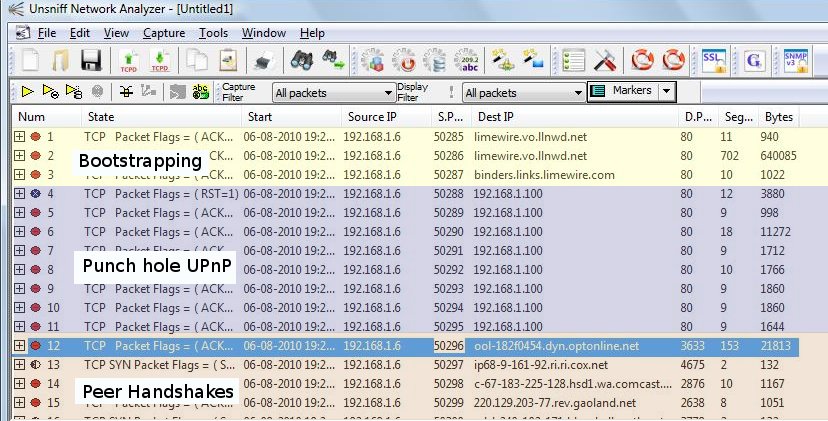
When Limewire first starts up, it uses plain HTTP to download a list of peers from one of many well known hosts. Next it attempts to punch a hole in your firewall using UPnP. It then selects a suitable peer based on your Geo location and starts a handshake process with it.More details about the bootstrapping process are available at the Gnutella Development Forum. You can observe the bootstrapping process in sessions 1,2,3 in the capture file Limewire_Complete.usnf .
Use of compression
The handshake takes place over a single TCP connection. The initial part of the handshake is in plaintext, but if both sides signal support for compression, the same TCP connection switches over to stream compression. Unsniff creates a “synthetic” uncompressed TCP stream corresponding to each compressed TCP handshake stream. You can view the uncompressed stream by opening the second capture file Limewire_Handshake.usnf .

Use of encryption
Many messages including the actual file transfers are encrypted using AES-128 whose keys are exchanged using Anonymous-Diffie Hellman. This is bad news because our forensics ability effectively ends here. But traffic analysis can give us the some clues about what might have been transferred across the encrypted session.

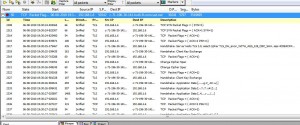
Here is the complete stream that was used to transfer the selected file (click for bigger picture). You can view the TLS handshake settling upon the Anon-DH key exchange protocol and AES128 encryption.
Messages
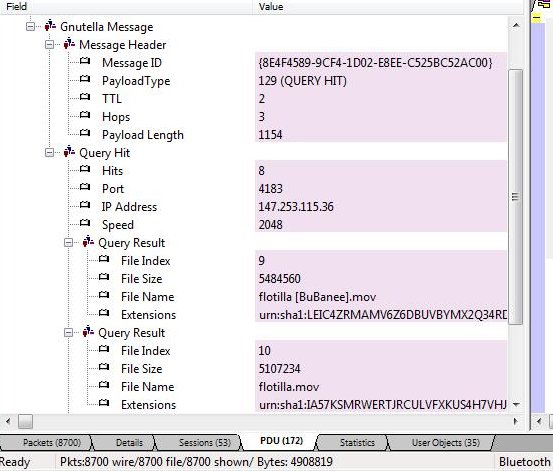
Gnutella defines a handful of messages and extensions. The relevant protocol messages for this exercise are QUERY and QUERY HIT. To view these messages,
- switch to the PDU sheet (we are far removed from link layer packets)
- click on a message to view its breakout
Analyzing Gnutella with Unsniff
Viewing Gnutella messages
1. With USNF files, you just have to open the capture file.
2. With PCAP files or live captures, you need to set up Unsniff to recognize Gnutella.
Since Gnutella uses random TCP ports, just assign Port 65535 to Gnutella. This is the special ‘catch all’ port in Unsniff. All unrecognized TCP traffic will be treated as Gnutella. To do this : Select Manage > Access Points > Click on TCP > Add Access Point > Enter 65535 + Gnutella.
3. Import the PCAP file or start a live capture
4. Look at the PDU sheet, it contains all the Gnutella messages.
Scripting to automate this task
To really use this in forensics applications you need to be able to script this stuff. Luckily Unsniff’s scripting API allows us to ditch the GUI altogether and run scripts to extract just what we want.
Here is a useful sample script in Ruby.
- This prints a list of peers, the filenames, and the SHA1 hash.
|
1 2 3 4 5 6 7 8 9 10 11 12 13 14 15 16 17 18 19 20 21 22 23 24 25 26 27 28 29 30 31 32 33 34 35 36 37 38 39 40 41 42 43 |
# ------------------------------------------------------------------ # qhit Print Gnutella Query Hit response details # ------------------------------------------------------------------ require 'win32ole' USAGE = "\nUsage : qhit capture-filename\n" EXAMPLE = "\nExample : qhit c:\\temp\\limewire-1.usnf\n" raise USAGE + EXAMPLE unless ARGV.length == 1 # Set up input InputFile = ARGV[0] UnsniffDB = WIN32OLE.new("Unsniff.Database") # Open capfile and get pdu index UnsniffDB.OpenForRead(InputFile) allPDUs = UnsniffDB.PDUIndex p allPDUs.Count # Scan each packet looking for netflow protocol id allPDUs.each do |pdu| root_field = pdu.Fields.Item(0) qhit_field = root_field.FindField("Query Hit") unless qhit_field.nil? ip=qhit_field.FindField("IP Address").Value port=qhit_field.FindField("Port").Value hits=qhit_field.FindField("Hits").Value print "\nQuery Hit IP #{ip} Port #{port} Hits #{hits}\n" qhit_field.SubFields.each do |qhf| if qhf.Name == "Query Result" file_name = qhf.FindField("File Name").Value sha1 = qhf.FindField("Extensions").Value print " #{file_name.ljust(50)} #{sha1[9..40].ljust(32)}\n" end end end end UnsniffDB.Close() |
Running this code as
|
1 |
ruby qhit.rb MyP2PCapture.usnf |
Produces this report containing the peer, files available, and their SHA-1 hash.
|
1 2 3 4 5 6 7 8 9 10 11 12 13 14 15 16 17 18 19 20 21 22 23 24 25 26 27 28 29 30 31 32 33 34 35 36 37 38 39 40 41 42 43 44 45 46 47 48 49 50 51 52 53 54 55 56 57 58 59 60 61 62 63 64 65 66 67 68 69 70 71 72 73 74 75 76 77 78 79 80 81 82 83 84 85 86 87 88 89 90 91 92 93 94 95 96 97 98 99 100 101 102 103 |
Query Hit IP 147.253.115.36 Port 4183 Hits 8 flotilla [BuBanee].mov LEIC4ZRMAMV6Z6DBUVBYMX2Q34RDVBCU flotilla.mov IA57KSMRWERTJRCULVFXKUS4H7VHJ7SG Timbaland - flotilla.mov GVVCPWCN4WHXUFGVJ3PLBI5RY5AEP5S5 02 flotilla.mov TQNV2GCUQ77RRYYIRWWH7ZTDGWAUQIBR flotilla [uploaded.by.YlAgEr].torrent UDLWSMLMC45EFYCNTZJT7VMPT7JIJ5ES flotilla.YlAgEr.zip 67JVZU6Z6R6276FP5O572NAELCYVLV4Y flotilla [crack][fixed].zip WZHQXB62JAVEPF7KLQXYJYH6ZA2DHSFK [CRACK].[flotilla].[by FFF].zip ZUF3YNZDV5XSCOO7YXXH73SEEYPF4TW4 Query Hit IP 71.196.30.141 Port 30241 Hits 1 [isoHunt]_2010_-_Super_Mario_Galaxy_2_Soundtrack.5584826.TPB[1].torrent AVB5S3DSP7JX7HWD5SXJFLRD5XIKT44O Query Hit IP 71.196.30.141 Port 30241 Hits 1 06 - Bowser Jr.'S Fiery Flotilla.mp3 NS5KQQC642HKYVDQBHG42IE4C3MVSWXZ Query Hit IP 187.48.197.152 Port 3144 Hits 1 006 flotilla.wma MRA7J53TK2GOPJ7L2BJZHYZRWANCLVTK Query Hit IP 127.32.23.144 Port 9707 Hits 1 flotilla.wma QLX3VNHDFKKCQPLQR2HTA7EZAQV4BJYY Query Hit IP 166.144.95.59 Port 7018 Hits 8 flotilla [xxSmokExx].mov LEIC4ZRMAMV6Z6DBUVBYMX2Q34RDVBCU flotilla.mov IA57KSMRWERTJRCULVFXKUS4H7VHJ7SG Kesha - flotilla.mov GVVCPWCN4WHXUFGVJ3PLBI5RY5AEP5S5 03 flotilla.mov TQNV2GCUQ77RRYYIRWWH7ZTDGWAUQIBR flotilla.qkelop.torrent UDLWSMLMC45EFYCNTZJT7VMPT7JIJ5ES flotilla.qkelop.zip 67JVZU6Z6R6276FP5O572NAELCYVLV4Y flotilla [crack][fixed].zip WZHQXB62JAVEPF7KLQXYJYH6ZA2DHSFK [CRACK].[flotilla].[by FFF].zip ZUF3YNZDV5XSCOO7YXXH73SEEYPF4TW4 Query Hit IP 166.144.95.59 Port 7018 Hits 8 flotilla [xxSmokExx].mov LEIC4ZRMAMV6Z6DBUVBYMX2Q34RDVBCU flotilla.mov IA57KSMRWERTJRCULVFXKUS4H7VHJ7SG Kesha - flotilla.mov GVVCPWCN4WHXUFGVJ3PLBI5RY5AEP5S5 03 flotilla.mov TQNV2GCUQ77RRYYIRWWH7ZTDGWAUQIBR flotilla.qkelop.torrent UDLWSMLMC45EFYCNTZJT7VMPT7JIJ5ES flotilla.qkelop.zip 67JVZU6Z6R6276FP5O572NAELCYVLV4Y flotilla [crack][fixed].zip WZHQXB62JAVEPF7KLQXYJYH6ZA2DHSFK [CRACK].[flotilla].[by FFF].zip ZUF3YNZDV5XSCOO7YXXH73SEEYPF4TW4 Query Hit IP 48.249.11.129 Port 18420 Hits 8 flotilla.[SCTV83].mov LEIC4ZRMAMV6Z6DBUVBYMX2Q34RDVBCU 02 flotilla.mov IA57KSMRWERTJRCULVFXKUS4H7VHJ7SG Iyaz - flotilla.mov GVVCPWCN4WHXUFGVJ3PLBI5RY5AEP5S5 06 flotilla.mov TQNV2GCUQ77RRYYIRWWH7ZTDGWAUQIBR [EZTV].flotilla.[WoDaJe].torrent UDLWSMLMC45EFYCNTZJT7VMPT7JIJ5ES flotilla[keygenWoDaJe].zip 67JVZU6Z6R6276FP5O572NAELCYVLV4Y flotilla [crack][fixed].zip WZHQXB62JAVEPF7KLQXYJYH6ZA2DHSFK [CRACK].[flotilla].[by FFF].zip ZUF3YNZDV5XSCOO7YXXH73SEEYPF4TW4 Query Hit IP 147.253.115.36 Port 4183 Hits 8 flotilla [BuBanee].mov LEIC4ZRMAMV6Z6DBUVBYMX2Q34RDVBCU flotilla.mov IA57KSMRWERTJRCULVFXKUS4H7VHJ7SG Timbaland - flotilla.mov GVVCPWCN4WHXUFGVJ3PLBI5RY5AEP5S5 02 flotilla.mov TQNV2GCUQ77RRYYIRWWH7ZTDGWAUQIBR flotilla [uploaded.by.YlAgEr].torrent UDLWSMLMC45EFYCNTZJT7VMPT7JIJ5ES flotilla.YlAgEr.zip 67JVZU6Z6R6276FP5O572NAELCYVLV4Y flotilla [crack][fixed].zip WZHQXB62JAVEPF7KLQXYJYH6ZA2DHSFK [CRACK].[flotilla].[by FFF].zip ZUF3YNZDV5XSCOO7YXXH73SEEYPF4TW4 Query Hit IP 71.196.30.141 Port 30241 Hits 1 [isoHunt]_2010_-_Super_Mario_Galaxy_2_Soundtrack.5584826.TPB[1].torrent AVB5S3DSP7JX7HWD5SXJFLRD5XIKT44O Query Hit IP 71.196.30.141 Port 30241 Hits 1 06 - Bowser Jr.'S Fiery Flotilla.mp3 NS5KQQC642HKYVDQBHG42IE4C3MVSWXZ Query Hit IP 187.48.197.152 Port 3144 Hits 1 006 flotilla.wma MRA7J53TK2GOPJ7L2BJZHYZRWANCLVTK Query Hit IP 127.32.23.144 Port 9707 Hits 1 flotilla.wma QLX3VNHDFKKCQPLQR2HTA7EZAQV4BJYY Query Hit IP 166.144.95.59 Port 7018 Hits 8 flotilla [xxSmokExx].mov LEIC4ZRMAMV6Z6DBUVBYMX2Q34RDVBCU flotilla.mov IA57KSMRWERTJRCULVFXKUS4H7VHJ7SG Kesha - flotilla.mov GVVCPWCN4WHXUFGVJ3PLBI5RY5AEP5S5 03 flotilla.mov TQNV2GCUQ77RRYYIRWWH7ZTDGWAUQIBR flotilla.qkelop.torrent UDLWSMLMC45EFYCNTZJT7VMPT7JIJ5ES flotilla.qkelop.zip 67JVZU6Z6R6276FP5O572NAELCYVLV4Y flotilla [crack][fixed].zip WZHQXB62JAVEPF7KLQXYJYH6ZA2DHSFK [CRACK].[flotilla].[by FFF].zip ZUF3YNZDV5XSCOO7YXXH73SEEYPF4TW4 Query Hit IP 166.144.95.59 Port 7018 Hits 8 flotilla [xxSmokExx].mov LEIC4ZRMAMV6Z6DBUVBYMX2Q34RDVBCU flotilla.mov IA57KSMRWERTJRCULVFXKUS4H7VHJ7SG Kesha - flotilla.mov GVVCPWCN4WHXUFGVJ3PLBI5RY5AEP5S5 03 flotilla.mov TQNV2GCUQ77RRYYIRWWH7ZTDGWAUQIBR flotilla.qkelop.torrent UDLWSMLMC45EFYCNTZJT7VMPT7JIJ5ES flotilla.qkelop.zip 67JVZU6Z6R6276FP5O572NAELCYVLV4Y flotilla [crack][fixed].zip WZHQXB62JAVEPF7KLQXYJYH6ZA2DHSFK [CRACK].[flotilla].[by FFF].zip ZUF3YNZDV5XSCOO7YXXH73SEEYPF4TW4 Query Hit IP 48.249.11.129 Port 18420 Hits 8 flotilla.[SCTV83].mov LEIC4ZRMAMV6Z6DBUVBYMX2Q34RDVBCU 02 flotilla.mov IA57KSMRWERTJRCULVFXKUS4H7VHJ7SG Iyaz - flotilla.mov GVVCPWCN4WHXUFGVJ3PLBI5RY5AEP5S5 06 flotilla.mov TQNV2GCUQ77RRYYIRWWH7ZTDGWAUQIBR [EZTV].flotilla.[WoDaJe].torrent UDLWSMLMC45EFYCNTZJT7VMPT7JIJ5ES flotilla[keygenWoDaJe].zip 67JVZU6Z6R6276FP5O572NAELCYVLV4Y flotilla [crack][fixed].zip WZHQXB62JAVEPF7KLQXYJYH6ZA2DHSFK [CRACK].[flotilla].[by FFF].zip ZUF3YNZDV5XSCOO7YXXH73SEEYPF4TW4 |
The SHA1 hash is in Base32.
Conclusions
It is possible to conduct network based forensics on P2P traffic, but it requires tools with advanced reconstruction abilities.
- You CAN conduct surveillance of location of content
- You CAN conduct surveillance of content being searched for
- You CANNOT reconstruct the file actually transferred due to encryption and use of Anon-Diffie-Hellman
- You CAN however get a fair idea, not of forensic evidence quality about what was transferred
—-
 I re-architected Trisul after months of intense coding to be able to take advantage of multiple cores. I just want to share the approach I took for this project.