Traffic and security monitoring with Trisul on Security Onion

tldr;
Want traffic, flow, and packet visibility along with IDS alert monitoring ?   Trisul running on the Security Onion distro is a great way to get it.

Trisul Network Metering & IDS alerts

Trisul‘s  main job is to monitor traffic statistics and correlate it with network flows and back everything up by raw packets.  This is presented in a slick web interface to give you great visibility into your network with drilldowns and drill-sideways available at every stage. Since its introduction a few weeks ago, we have managed to win over quite a few passionate users.

At the moment, most of Trisul’s users are using it for traffic and flow monitoring. A major feature of Trisul is that it can accept IDS alerts from Snort and Suricata and merge this information with traffic statistics and packets. This requires a bit of setup involving Snort/ Barnyard2/ Pulled Pork as described in this doc.  I found the Security Onion distro recently and was pleasantly surprised how easy Doug Burks, its author has made it to get this up and running.  This is an ideal platform to exercise the alerts portion of Trisul.  The only sticking point was Trisul is 64-bit only, courtesy its love affair with memory.  We made a 32-bit package specially for Sec-O.  This post describes how to set it up and what it can do for you.

Plugging in Trisul

The following sketch illustrates how Trisul plugs into the Sec-O components.

  1. It accepts raw packets from the network interface directly
  2. It accepts IDS alerts from barnyard2 via a Unix Socket

You can use SGUIL, the primary NSM application in Security Onion side-by-side with Trisul.
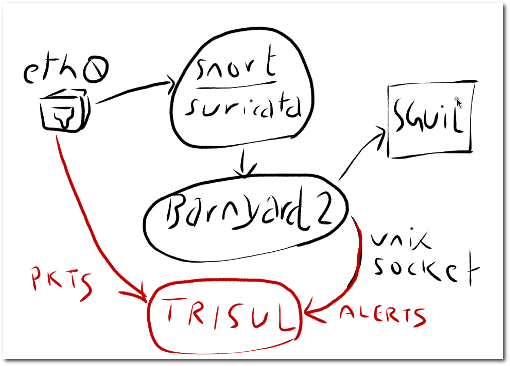
Trisul plugs into NSM components
Trisul - alerts from barnyard2 - packets from eth0

Installing Trisul

5 min screencast

Download

You have to get these from the Trisul download page – scroll to the bottom to access Ubuntu 32 bit builds

  • DEB package (Trisul server)
  • The TAR.GZ package (the Web Interface)

Install

Follow the instructions in the Quick Start Guide to install the packages.

Once installed, run once to setup everything

cd /usr/local/share/trisul
./cleanenv -f -init
/usr/local/share/webtrisul/build/webtrisuld start

Configure

Change data directory from /usr/local/var to /nsm

Trisul stores its data in /usr/local/var, Sec-O likes to store it in /nsm. You may wish to change to /nsm/trisul_data

To do so
mkdir /nsm/trisul_data
cd /usr/local/share/trisul
./relocdb -t /nsm/trisul_data

Edit trisulConfig.xml file

You want to change two things in the config file. The user running the Trisul process and the location of the unix socket that barnyard2 writes to.

  1. Change the SetUid parameter in /usr/local/etc/trisul/trisulConfig.xml to sguil.sguil
  2. Change the SnortUnixSocket  to /nsm/sensor_data/xxx/barnyard2_alert

Edit barnyard2.conf to add unix socket output

Edit the barnyard2.conf file under /nsm/sensor_data/xx/barnyard2.conf and add the following link

Start Trisul with mode fullblown_u2

You are all set now, just restart everthing. The trisul runmode must be fullblown_u2.

Stopping

/etc/init.d/trisul stop
/etc/init.d/webtrisuld stop

Starting
You also have to restart trisul,webtrisul, and barnyard2.


trisul -demon /usr/local/etc/trisul/trisulConfig.xml -mode fullblown_u2
/etc/init.d/webtrisuld start

The webinterface for Trisul listens on port 3000. Make sure you have opened it in iptables.

iptables -I INPUT -p tcp --dport 3000 -j ACCEPT

Using Trisul

Login to http://myhost:3000 as admin /admin.  Here are a few screenshots of what you can do with Trisul. I encourage you to play with the interface and navigate statistics/ flows/ pcaps.

Screencast 2: Beginning Trisul

Usage 1 : Traffic metering

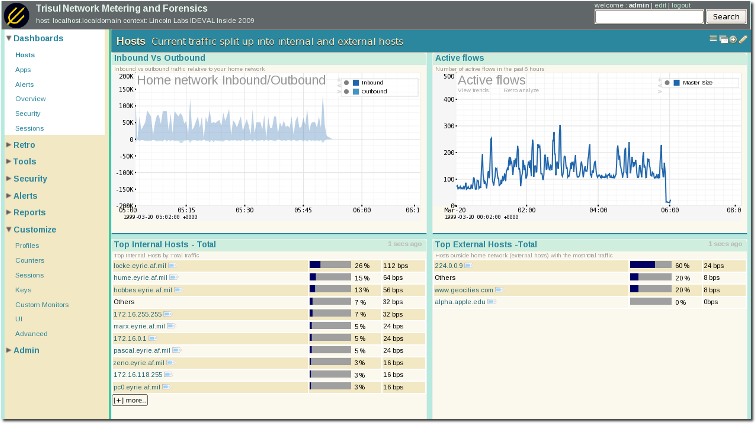
Think of it as ntop on a truck load of steroids. Over 100+ meters available out of the box – you can monitor traffic by hosts, macs, as internal vs external, vlans, subnets – even complex criteria like HTTP hosts, content types, country, ASN, web category etc etc.

In the sceenshot below, you can click on a host to investigate what its doing, what its historical usage is, exact flow activity or even pull up packets.
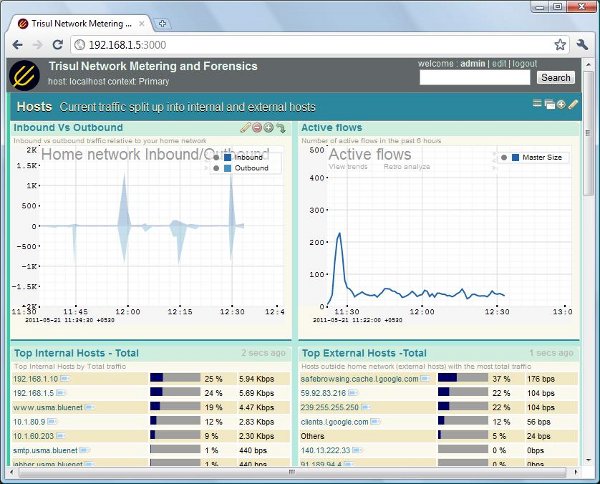
Metering
Fine grained metering of network traffic

Usage 2 : Alert as entry point of analysis

Clicking on Dashboards > Security gets you to this screen. You can click on each alert category to investigate further. You can pull up relevant flows and packets. Watch the screencast below for an example.
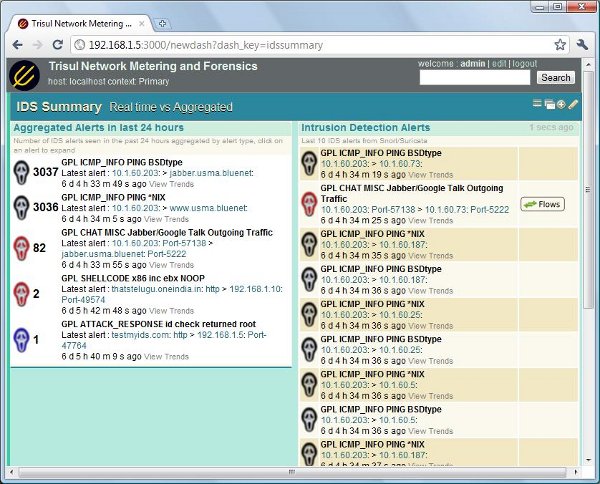
IDS alerts
Start you analysis from IDS alerts

Download and try Trisul today

Trisul is free to download and run. There are no limitations other than the fact that only the most recent 3 days are available for investigations. If you like it you can upgrade at any time to remove the restriction. There are no nags or call homes of any kind.

Get it from here now

Seeing 25,000 byte packets in Wireshark ? Super packets

TL;DR;

Do you get giant packets upto 64K bytes from Wireshark or Libpcap ? It could be due to GSO (Generic Segmentation Offload) a software feature enabled on your ethernet card.

This is probably going to be really obvious to the packet gurus, but a recent investigation took me by surprise.

I always assumed that packets captured using libraries like libpcap would have the same size of the link layer MTU. The largest packets I have seen on ethernet links are 1514 bytes. I have also seen some packet captures containing Gigabit Ethernet Jumbo frames around 9000 bytes. I had read a lot about TCP Segmentation Offload but had never seen a capture of it. To sum it up, a really big packet to me meant 1514 bytes for the most part.

Imagine my surprise when I looked at some packets captured by Trisul and some were about 25,000 bytes. Some were even 62,000 bytes.

Some facts:

  • I was on a Gigabit Ethernet port (Intel e1000), but it was running at 100Mbps.
  • TCP Segmentation Offload which could cause such huge packets was turned off.
  • This only happened at high speeds of 96Mbps and only for TCP
  • This only happened on Ubuntu 10.04+ and not on Centos 5.3+

Packet capture file in Wireshark format (tcpdump)

ethtool output


unpl@ubuntu:~$ sudo ethtool eth0
Settings for eth0:
Supported ports: [ TP ]
Supported link modes:   10baseT/Half 10baseT/Full
100baseT/Half 100baseT/Full
1000baseT/Full
Supports auto-negotiation: Yes
Advertised link modes:  10baseT/Half 10baseT/Full
100baseT/Half 100baseT/Full
1000baseT/Full
Advertised pause frame use: No
Advertised auto-negotiation: Yes
Link partner advertised link modes:  Not reported
Link partner advertised pause frame use: No
Link partner advertised auto-negotiation: No
Speed: 100Mb/s
Duplex: Full
Port: Twisted Pair
PHYAD: 1
Transceiver: internal
Auto-negotiation: on
MDI-X: off
Supports Wake-on: pumbag
Wake-on: g
Current message level: 0x00000001 (1)
Link detected: yes
unpl@ubuntu:~$

The test load :

Around 96-100Mbps consistent generated via iperf.  All traffic measured and logged down to packet level by Trisul.  In my tests, superpackets only showed up at really high data rates. If I dropped the load to say 30 Mbps, all packets would be a maximum of 1514 bytes – as expected.

Consistent load of 96 Mbps seen by Trisul

Drilling down into the iperf packets  :

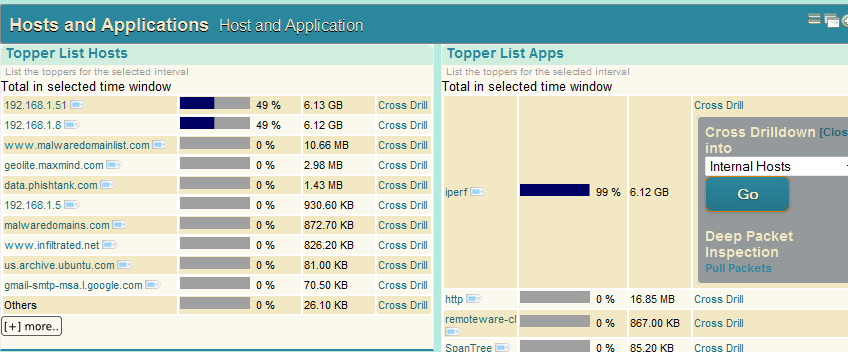
Viewing the top applications contributing to the 96-100Mbps load, we find iperf at the top as expected. I drilled down further into the packets by clicking the “Cross Drill” tool.

Get some of the iperf packets in the time interface

Found really big packets in the list  :

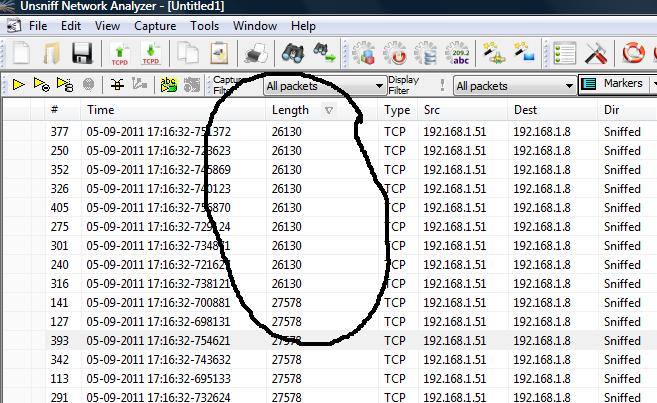
Clicking on “Pull Packets” gave me  a pcap file I imported into Unsniff. Immediately the packet sizes took me by surprise.

Many super packets

How can we have 27578 byte packets ?

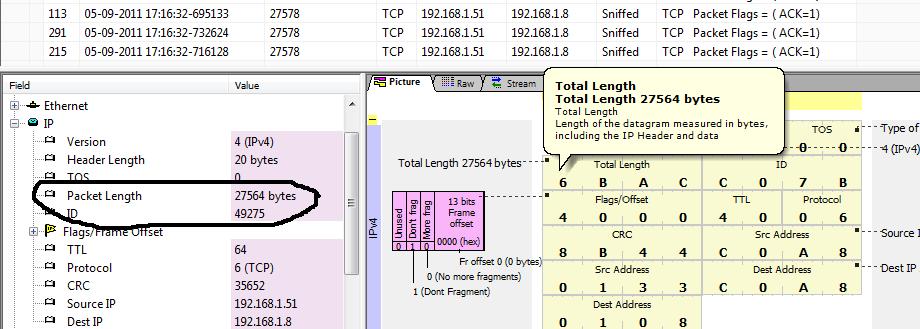
It turns out that somehow the IP packets have been merged into one big packet and instead of passing multiple ethernet packets up the stack, the kernel is reassembling it as one IP packet.  The IP Total Length field is adjusted to reflect the reassembled super packet. Unsniff’s packet breakout view shows this clearly.


IP Total Length has a Huge Value covering multiple ethernet packets

This caused me some grief because I suspected there were some packet buffers in Trisul that maxed out at 16K. So I had to find what these superpackets were.

Enter Generic Segmentation Offload

After much Googling I found some links that looked promising.  Recall that the adapter was in 100Mbos mode and had TCP Segmentation Offload off . I later noticed it Generic Segmentation Offload On . This is a software mechanism introduced in the networking stack of recent Linux.

End piece

If you are analyzing packets in Wireshark and run into super sized packets. They are probably due to the Generic Segmentation Offload feature.   Those who are, like me, write code for packet capture, relay, and storage,  pay extra attention. Do not use arrays of sizes like 16K while buffering packets. You need to use the maximum allowed IP Total Length size of 64K.

PS:

Still doesnt explain why this is only for TCP

Trisul updated with brand new UI – download 1.2.704 now !

We have been very busy tinkering on Trisul these past few weeks.  The end result is a much cleaner looking and better performing Trisul.

The new release (1.2.704) is now available for both Ubuntu 10.04 and Centos 5.3+ 64-bit platforms.  The full list of enhancements and new features are listed here.

Lets check out the most significant enhancement.

The new user interface

Here is what the new user interface looks like.

The new UI
The new UI

The key advantages of the new user interface are :

  • A more natural left menu
  • The menu remembers expanded and selected state of items
  • The menu can be collapsed or expanded at any time by pressing the edge of the menu or Ctrl+M
  • Use of a color scheme and better use of CSS padding and elimination of unnecessary gradients
  • You can switch back to the plain black and white user interface via Customize -> UI -> Themes

Netflow Routers and Interfaces view

Did you know that Trisul can accept Netflow ? Yes. It can accept Netflow v5 and v9 records and also all versions of SFlow. It can handle tens of thousands of flows per second thanks to the high performance native server. For those using Netflow, we have a new Tool called “Routers and Interfaces”. This allows you to drilldown into interface level activity – while still maintaining an overall network level view.

You can do both :

  • A network level view of top hosts, applications, router interfaces,and overall top flows
  • An interface specific view of top hosts, applications, and flows

Thanks for the great initial response to Trisul . Please download the latest builds today and demystify your network.